Lbdb debugger - 0xCC
Something more about breakpoints.
Note: I’m also learning. If you find any wrong or misleading information, please write to me.
Note: All the code you may find at my github in Lbdb_debugger repository
From the latest post about DWARF debugging data format we have learnt how to retrieve information from the file. In my case I needed information about function address to set a breakpoint on it, by simply writing break main. In this post I will cover the topic how it is done and try to make the debugger work as it should, allowing to run, continue the execution, set and delete the breakpoints.
We will start with the main topic - the breakpoints.
What is the breakpoint? According to the Wikipedia:
In software development, a breakpoint is an intentional stopping or pausing place in a program, put in place for debugging purposes. It is also sometimes simply referred to as a pause.
I read the whole article and I must said it does not contains the most important information. So we need to go deeper and take in our hand the Intels manuals (Vol. 3A 6-23)!
Interrupt 3—Breakpoint Exception (#BP). Indicates that a breakpoint instruction (INT 3, opcode CCH) was executed, causing a breakpoint trap to be generated. Typically, a debugger sets a breakpoint by replacing the first opcode byte of an instruction with the opcode for the INT 3 instruction. (The INT 3 instruction is one byte long, which makes it easy to replace an opcode in a code segment in RAM with the breakpoint opcode.)
Now we have some useful information!
Astute reader noticed the opcode CCH which is the same as my 0xCC in the post title. There is one very important information a debugger sets a breakpoint by replacing the first opcode byte of an instruction with the opcode for the INT 3 instruction.
So it should work like this. We have got out function at 0x400526. Under this address let’s assume we have got 0x12345678 The first opcode of this instruction is 78. You may ask, But why? It is the last one!. Remember that x86 is Little Endian so in the hexdump it would look like follows 78 56 34 12.
As it should be replaced we would receive cc 56 34 12 which is 0x123456cc. Ok, but is only my assumption. We need to check this in code!
So first lets implement function which will be setting our brakepoint:
//function responsible for making breakpoints (injecting 0xcc byte)
int make_a_break(functionList *head, int8_t *function, pid_t childPID, breakpointsList **bHead, int32_t *counter){
  uint32_t addr;

  while(head != NULL){
    if(strcmp(head->function_name,function)==0){
      addr = head->address;
      printf("Breakpoint set at function: %s\n", head->function_name);
      break;
    }
    head = head->next;
  }

  uint64_t data = ptrace(PTRACE_PEEKTEXT, childPID, (void*)addr, 0);
  printf("Breakpoint set at: 0x%08x (0x%08x)\n", addr, data);

  add_to_breakpoints_list((*bHead), addr, data, function);

  uint64_t trap = (data & ~0xFF) | 0xCC; //last byte as architecture is little endian
  ptrace(PTRACE_POKETEXT, childPID, (void*)addr, (void*)trap);

  uint64_t data2 = ptrace(PTRACE_PEEKTEXT, childPID, (void*)addr, 0);
  printf("0x%08x --> 0x%08x\n", data, data2);

  (*counter)++;
  printf("Number of breakpoints: %i\n", (*counter));
  return 0;
}
From the begining. Firstly we are searching choosen function in our functions linked list. When we find the name of the function we are retrieving its address and perform injecting 0xCC with the most important line in this function:
uint64_t trap = (data & ~0xFF) | 0xCC; //last byte as architecture is little endian
Which sets our first offset byte to cc.
data and data2 are storing actual values of the function address, so line printf("0x%08x --> 0x%08x\n", data, data2); should show us if everythin is working as expected. Let’s try it out:
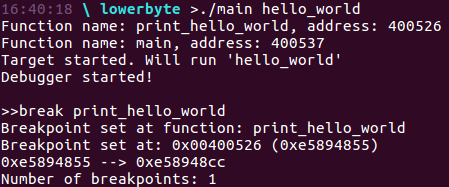
And bum! We have injected the breakpoint byte. But does this work? I mean, will it stop the program execution? Let’s assume we’ve got our debugger already working as it supposed to, so we can test if the cc works (as I’ve got it right now ;)):
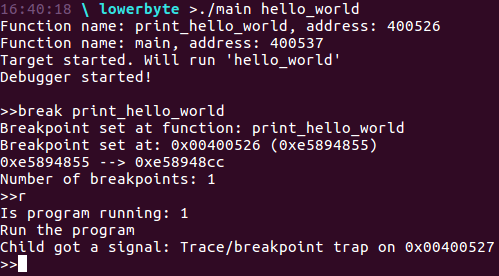
It works! Simple 0xCC allowed us to stop the program execution! It is incredible and you must admit it!
But why information that breakpoint opcode is one byte is important ;-;
It is because the smallest possible instruction on x86 is one byte so there is no chance for breakpoint to overwrite any other instructions bytecode. Just imagine the situation where setting breakpoint is overwriting other instruction! In fact lets take a look at following example. Let’s assume we have following code (just theoretically):
push	rbp
mov	rbp, rsp
mov	edi, 0x400526
call	0xdeadbeef
It’s hexdump will look like this:
-offset- 0 1 2 3 4 5 6 7 8 9 A B C D E F
0x000000 55 48 89 e5 bf 26 05 40 00 e8 e1 be ad de
If we would set the breakpoint at 0x0 it would look like this (push opcode is 50+rd which is destination register and has 5 bits):
-offset- 0 1 2 3 4 5 6 7 8 9 A B C D E F
0x000000 cc 48 89 e5 bf 26 05 40 00 e8 e1 be ad de
And finally, when breakpoint would have more than one byte, for example 12 bits opcode we would overwrite the next byte:
-offset- 0 1 2 3 4 5 6 7 8 9 A B C D E F
0x000000 cc c8 89 e5 bf 26 05 40 00 e8 e1 be ad de
Which can have terrible consequentions!
Now we know how to set up a breakpont, how it is done under the hood and why it has only one byte opcode. So let’s move on with deleting the breakpoint!
Deleting the breakpoint is very easy and to it we have to replace the 0xCC with the old value. To remember this value I’m using the following struct:
//member of breakpoint list
//NOTE: parameter function is added, but not used
typedef struct deb{
  uint64_t data;
  uint64_t addr;
  int8_t *function;
  struct deb *next;
}breakpointsList;
Where data is the data under the address addr. The function to restore the data is named delete_breakpoint and look as follows:
int delete_breakpoint(breakpointsList **head, breakpointsList *bHead, int32_t breakpoint_number, pid_t childPID, int32_t *counter){
  for(int32_t i = 1; i < breakpoint_number; i++){
    bHead = bHead->next;
  }

  int64_t data = ptrace(PTRACE_PEEKTEXT, childPID, (void*)bHead->addr, 0);
  data = data & ~0xff;

  uint64_t disable_trap = (bHead->data & 0xFF) | data;
  ptrace(PTRACE_POKETEXT, childPID, (void*)bHead->addr, (void*)disable_trap);

  if(breakpoint_number == 1)
    remove_breakpoint(head, bHead, breakpoint_number);
  else if(breakpoint_number > 1 && breakpoint_number < breakpoint_counter)
    remove_breakpoint(head, bHead, breakpoint_number);
  else remove_last_breakpoint(head, bHead, breakpoint_number);
  (*counter)--;
  cnt--;
  return 0;
}
But deleting the breakpoint is different from continuing the execution after the breakpoint. When continuing the execution you have to restore the old value in 0xCC but also you have to set Instruction pointer register to point before the breakpoint. Normally you would like to restore the breakpoint after continuing, but I did not implement it. Just because.
//function removing the 0xcc byte
//NOTE: I do not restore the breakpoint after continuation of the program
int continue_execution(functionList *head, pid_t childPID, int8_t *function, breakpointsList *bHead){
int32_t wait_status;
for(int32_t i = 0; i < cnt; i++){
printf("BHead addr: 0x%08x BHead data: 0x%08x\n", bHead->addr, bHead->data);
bHead = bHead->next;
}
cnt++;
int64_t data = ptrace(PTRACE_PEEKTEXT, childPID, (void*)bHead->addr, 0);
data = data & ~0xff;
uint64_t disable_trap = (bHead->data & 0xFF) | data;
int64_t data2 = ptrace(PTRACE_PEEKTEXT, childPID, (void*)bHead->addr, 0);
printf("Before break: 0x%08x (0x%08x)\n", bHead->addr, data2);
ptrace(PTRACE_POKETEXT, childPID, (void*)bHead->addr, (void*)disable_trap);
data2 = ptrace(PTRACE_PEEKTEXT, childPID, (void*)bHead->addr, 0);
printf("After break: 0x%08x (0x%08x)\n", bHead->addr, data2);
ptrace(PTRACE_GETREGS, childPID, 0, ®s);
regs.rip = bHead->addr;
ptrace(PTRACE_SETREGS, childPID, 0, ®s);
ptrace(PTRACE_CONT, childPID, 0, 0);
wait(&wait_status);
if (WIFSTOPPED(wait_status)) {
printf("Child got a signal: %s\n", strsignal(WSTOPSIG(wait_status)));
}
else if(wait_status == 0){
puts("Program ended.");
is_program_running = 1;
return 2;
}
else{
printf("Child got a signal: %s\n", strsignal(WSTOPSIG(wait_status)));
return -1;
}
The result of this function is shown below:
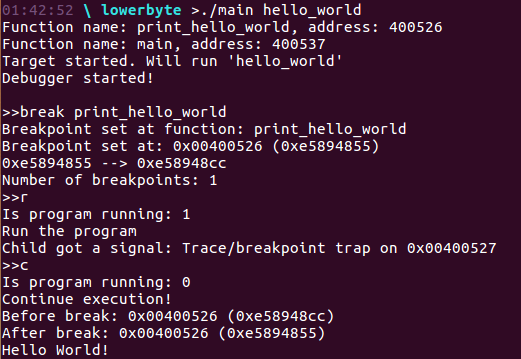
As we can see we manage to set a breakpoint on function by simply writing break print_hello_world, then we run a program which stopped at aour breakpoint with the message Trace/breakpoint trap on and at the end we continued the execution, by restoring the previous value and change rip register.
Look how many things had to be done to allow us to set a trap using function name!
The whole code is on my github, so feel free to use it, change it or do whatecer you want. I hope I managed to show you how debuggers work under the hood using the ptrace and debugging information. See you!