Lbdb debugger - DWARFs and ELFs!
Aka how to get to the debugging information of the program.
Note: I’m also learning. If you find any wrong or misleading information, please write to me.
Note: All the code you may find at my github in Lbdb_debugger repository
In my latest post I wrote that I was curious how the gdb knows where to put the breakpoint, when I write break main. Then I start to digging and find out that for ELF file those information are store in DWARF debugging data fromat.
Firstly, we need to make some things clear.
The task of a debugger is to provide the programmer with a view of the executing program in as natural and understandable fashion as possible, while permitting a wide range of control over its execution. This means that the debugger has to essentially reverse much of the compiler’s carefully crafted transformations, converting the program’s data and state back into the terms that the programmer originally used in the program’s source.
The challenge of a debugging data format, like DWARF, is to make this possible and even easy[1].
Ok, so what exaclty this DWARF is?
DWARF stands for Debugging With Arbitrary Record Formats and is something of a pun, since it was developed along with the ELF object file format[1].
The DWARF description of a program is a tree structure, similar to the compiler’s internal tree, where each node can have children or siblins. The nodes may represent types, variables, or functions. This is a compact format where only the information that is needed to describe an aspect of a program is provided. The format is extensible in a uniform fashion, so that a debugger can recognize and ignore an extension, even if it might not understand its meaning[1].
Before you continue make sure you have read the [2] to have better understanding of the problem.
Great, so it’s tree like structure which allows us to retrieve any useful information. Let’s try to write some simple program and see how this looks in practice.
The program looks like follows:
#include<stdio.h>

void print_hello_world(){
    puts("Hello World!");
}

int main(){
    print_hello_world();
    return 0;
}
As you can see it is very basic program which use function print_hello_world to put Hello World! on the screen. According to the previous we should get some debugging information after the compilation of the program, so let’s do it. Now we have out a.out file, but how the hell get to the DWARF information?!
I did not know that either so I just write this question in Google and the second link ([3]) gave me the answer, which is readelf (yea, suprising).
Man page of the readelf tells us that if we use it with the -w parameter we will get to the DWARF debbuging information:
-w(…) Displays the contents of the DWARF debug sections in the file, if any are present. Compressed debug sections are automatically decompressed (temporarily) before they are displayed. If one or more of the optional letters or words follows the switch then only those type(s) of data will be dumped. (…)
There are lots of options so as always I recommend you to read the man page.
Ok, back to the topic, let’s use it on out compiled program. We will use -wi parameter to display the .debug_info section.
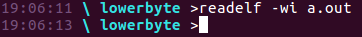
Ok, something went wrong. Maybe there is no .debug_info section? To check it we can use objdump with -h option. Output of this function is rather big, so I would not paste it here, but you have to belevie me that I was right and there wasn’t such section. But why?
Couple of minutes later (which were spent on searching on Google) I found this one very, very useful gcc option:
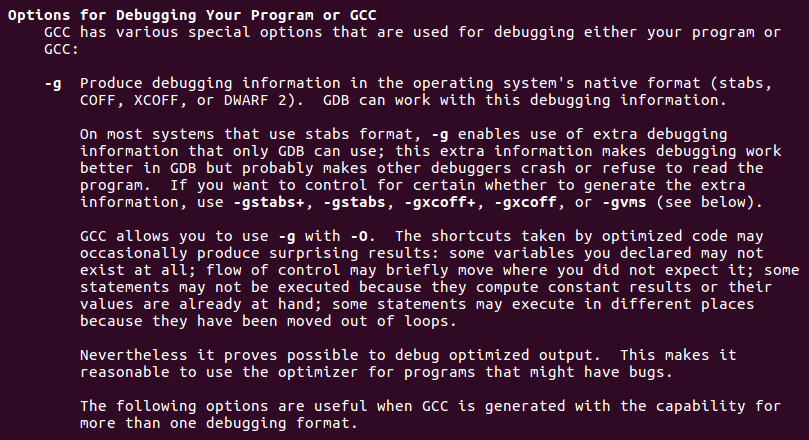
So lets compile it with the powerfull -g option and look what happens.
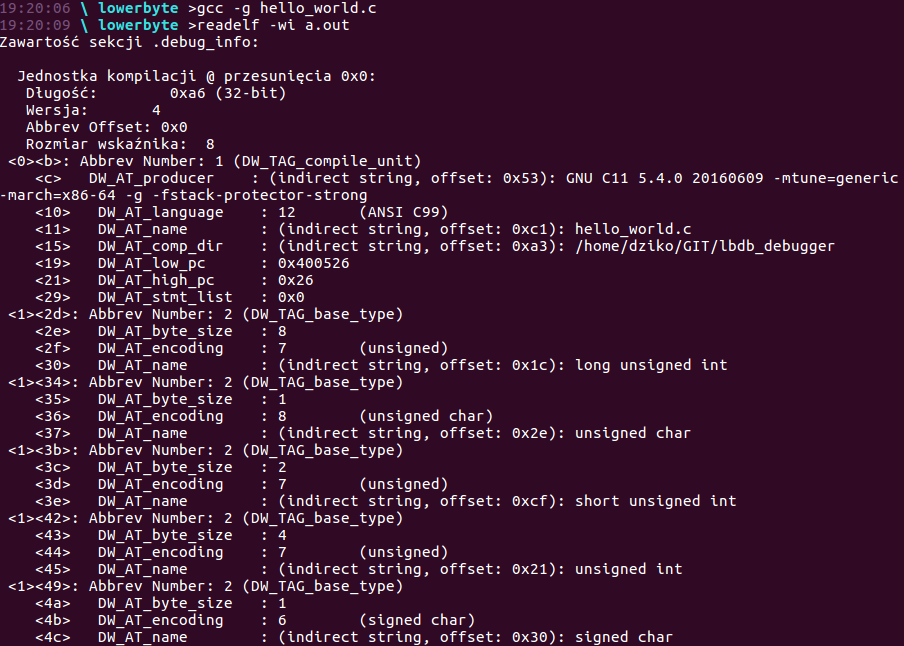
Now we’re talking! We received some kind of tree structure!
To fully understand the rest of the post, please read [1], as I will not describe lots of DWARF features like DIEs I will focus on getting those information rather than explaining it. You may easily Google it
Ok, so now we have what we want. The DWARF debugging information. But how can we use it in the debugger?
The answer is libdwarf and libelf!
If you are on Linux to install them just simply write sudo apt-get install libdwarf-dev, libelf-dev. Unfotunately the documentation of this library is very poor. I have found one old paper, but it was still valid [4]. One more time, before start using the libdwarf and before continuing please read this paper.
After getting trough [4] I manage to write following program. It is part of lbdb_dwarf.c at my github after the ONLY FOR TESTING PURPOSE sentance.
First we have to declare the Dwarf_Error and Dwarf_Debug instances and pointer to an Elf structure. The fd ind res are helper variables.
Elf *elf = NULL;
Dwarf_Error err;
Dwarf_Debug dbg; //An instance of the Dwarf_Debug type is created as
                 //a result of a successful call to dwarf_init()
int fd = -1; //file descriptor. At initialization has to be lower than 0, as 0 is stdin.
int res = -2;
When it’s done we have to establish connection between debugged file and it’s descriptor. The open() function from fnctl.h does the job.
if((fd = open(elf_name, O_RDONLY)) < 0){  //open() (fnctl.h) to establish the connection
                                          //between a file and a file descriptor
    puts("Oh no! The file failed on open!");
    return 1;
  }
Next steps are responsible for initialization of DWARF and for cleaning.
if (elf_version(EV_CURRENT) == EV_NONE){
	  puts("elf_version return with error");
    return 1;
  }

  if((elf = elf_begin(fd, ELF_C_READ, (Elf*)0)) == 0){
    puts("elf_begin failed.");
    printf("Value of elf pointer: %p\n", elf);
    return 1;
  }

  if((res = dwarf_elf_init(elf, DW_DLC_READ, 0, 0, &dbg, &err)) != DW_DLV_OK){
    if(res == DW_DLV_ERROR){
      puts("dwarf_init returned DW_DLV_ERROR");
      *
       * An Dwarf_Error returned from dwarf_init() or dwarf_elf_init() in case
       * of a failure cannot be free’d using dwarf_dealloc(). The only way to
       * free the Dwarf_Error from either of those calls is to use free(3)
       * directly. Every Dwarf_Error must be free’d by dwarf_dealloc() except
       * those returned by dwarf_init() or dwarf_elf_init().
       *
      free(err);
      return 2;
    }
    else{
      //If DW_DLV_NO_ENTRY is returned no pointer value in the interface returns a value.
      puts("dwarf_init returned DW_DLV_NO_ENTRY");
      return 3;
    }
  }

  puts("Checking");
  printf("elf adress 1: %p %p \n", &elf, elf);
  if(dwarf_get_elf(dbg, &elf, &err) != DW_DLV_OK){
    printf("dwarf_get_elf return with error: %i\n", res);
    return 4;
  }else puts("Getting_elf");
  printf("elf adress 2: %p %p \n", &elf, elf);

  if(dwarf_finish(dbg, &err) != DW_DLV_OK){
    printf("dwarf_finish return with error: %i\n", res);
    return 5;
  }
  puts("Finishing dwarf");
  *
   * Because int dwarf_init() opens an Elf descriptor on its fd and
   * dwarf_finish() does not close that descriptor, an app should
   * use dwarf_get_elf and should call elf_end with the pointer
   * returned thru the Elf** handle created by int dwarf_init().
   * *
  elf_end(elf);
  puts("Cleaning done!");
  return 0;
If this program executes successfully this means we did everything as we should and the DWARF debugging information are now avaiable for us to read them.
But before this quick introduction to breakpoints which will be covered in the next post. When you want to set a breakpoint in gdb you write something like break *0x400850 or atleast you would have to if debugging information weren’t avaiable. So whenever you set a breakpoint in gdb like break main, the debugger reaches the debugging information (DWARF in our case) and searching for tag DW_TAG_subprogram, which means function in “DWARFish”. Then it looks up for it’s attribiutes and searching for the functions address (like 0x0400850) and injects the special byte.
So I want my debugger to have such abillity to set a breakpoint using only the function name. To do this let’s write functions which will help us to do it.
The first one -get_function_tag- will be responsible for searching kids or siblings in the DWARF tree with the DW_TAG_subprogram and when it finds it we will invoke the function -get_function_name- which will get the function name and address.
//getting function tag. If tag == DW_TAG_subprogram this what we want
int get_function_tag(Dwarf_Debug dbg, Dwarf_Error err, functionList **head){

  Dwarf_Unsigned cu_header_length, abbrev_size, next_cu_header;
  Dwarf_Half version_stamp, address_size;
  Dwarf_Die die = NULL, sib_die, kid_die;
  int res, next_cu;

  if((next_cu = dwarf_next_cu_header(dbg, &cu_header_length, &version_stamp, &abbrev_size, &address_size, &next_cu_header, &err)) == DW_DLV_ERROR){
    puts("dwarf_next_cu_header failed!");
    dwarf_dealloc(dbg, err, DW_DLA_ERROR);
    return 6;
  }

  while(next_cu != DW_DLV_NO_ENTRY){
  /*
   * If die is NULL, the Dwarf_Die descriptor of the first die
   * in the compilation-unit is returned. This die has the
   * DW_TAG_compile_unit tag.
  */
    if(dwarf_siblingof(dbg, die, &sib_die, &err) == DW_DLV_ERROR){
      puts("dwarf_siblingof failed!");
      dwarf_dealloc(dbg,err,DW_DLA_ERROR);
      return 7;
    }


    if(dwarf_child(sib_die, &kid_die, &err) != DW_DLV_OK){
      puts("dwarf_child failed!");
      dwarf_dealloc(dbg,err,DW_DLA_ERROR);
      return 8;
    }

    while(true){
      Dwarf_Half tag;
      if(dwarf_tag(kid_die, &tag, &err) != DW_DLV_OK){
        puts("dwarf_tag failed!");
        dwarf_dealloc(dbg,err,DW_DLA_ERROR);
        return 9;
      }

      if(tag == DW_TAG_subprogram){
	//we have found the function!
	//let's get the name and the address of it
        get_function_name(dbg, kid_die, err, head);

      }
      res = dwarf_siblingof(dbg, kid_die, &kid_die, &err);

      if (res == DW_DLV_ERROR)
        puts("Error getting sibling of DIE\n");
      else if (res == DW_DLV_NO_ENTRY)
        break;
    }

    next_cu = dwarf_next_cu_header(dbg, &cu_header_length, &version_stamp, &abbrev_size, &address_size, &next_cu_header, &err);
  }

  dwarf_dealloc(dbg, die, DW_DLA_DIE);
  dwarf_dealloc(dbg, kid_die, DW_DLA_ATTR);
  dwarf_dealloc(dbg, sib_die, DW_DLA_ATTR);

  return 0;
}
What it does it’s just simply go trough the whole tree and searchs the tag. I think there one explanation is needed regarding the functionList **head. It is pointer to the structure functionList which is defined in function_list.h and it is linked list responsible for storing the function name and it’s address.
typedef struct structure{
  uint32_t address;
  const char* function_name;
  struct structure *next;
} functionList;
Ok, so now I want to give some attention to this:
//function to retrieve address and name of each function in debugged file
int get_function_name(Dwarf_Debug dbg, Dwarf_Die die, Dwarf_Error err, functionList **head){

  Dwarf_Half attr = 0x3; //DWA_AT_name = 0x3 from DWARF documentation
  Dwarf_Attribute return_attr = NULL;
  Dwarf_Addr return_lowpc;
  char *f_name;
  int32_t res = -2;

  if((res = dwarf_attr(die, attr, &return_attr, &err)) != DW_DLV_OK){
    if(res == DW_DLV_NO_ENTRY){
      puts("No attribute: name");
      return 10;
    }
    else{
      puts("dwarf_attr failed!");
      dwarf_dealloc(dbg, err, DW_DLA_ERROR);
      return 11;
    }
  }

  if(dwarf_formstring(return_attr, &f_name, &err) != DW_DLV_OK){
      puts("dwarf_formstring failed!");
      dwarf_dealloc(dbg,err,DW_DLA_ERROR);
      return 12;
  }

  if((res = dwarf_lowpc(die, &return_lowpc, &err)) != DW_DLV_OK){
    if(res == DW_DLV_NO_ENTRY){
      puts("No attribute: lowpc");
      return 13;
    }
    else{
      puts("dwarf_lowpc failed!");
      dwarf_dealloc(dbg, err, DW_DLA_ERROR);
      return 14;
    }
  }
  add_to_function_list(*head, return_lowpc, f_name);

  dwarf_dealloc(dbg, f_name, DW_DLA_STRING);
  dwarf_dealloc(dbg, return_attr, DW_DLA_ATTR);

  return 0;
}
All those dwarf_lowpc of dwarf_fromstring are responsible for getting information from DWARF tree but I’m sure you know this, as earlier I told you to read the [4]. ; )
Output of those file should give us the list of all functions and their addresses form our example program, so let’s give it a try!
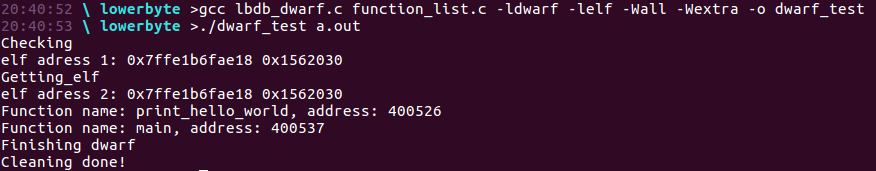
Something worked! As you can see we have got 2 functions:
Function name: print_hello_world, address: 400526
Function name: main, address: 400537
which are exactly those from our example file! Or aren’t they?
Names are correct, but what with addresses? Let’s use the gdb and find out!
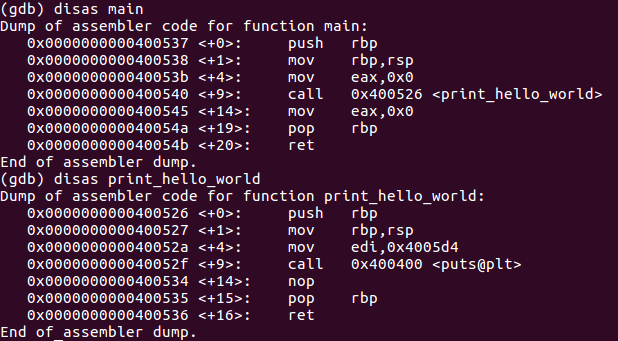
YES! Everything is correct!
Now we have a powerful tool for our debugger. We will use it widely.
Hope you had a lot of fun reading this and you learned lots of new things! Take care!
[1]. Introduction to the DWARF Debugging Format, Michael J. Eager, Eager Consulting, April, 2012.
[2]. https://www.ibm.com/developerworks/aix/library/au-dwarf-debug-format/index.html
[3]. https://sourceware.org/binutils/docs/binutils/readelf.html
[4]. ftp://ftp.software.ibm.com/software/os390/czos/dwarf/libdwarf2.1.pdf